
CircleUp has spent the last six years building a data moat – a vast pool of data that prevents others from invading. Data is our primary asset and is the backbone of the machine learning platform we call Helio. But these days there is nothing unique about collecting and storing absurd quantities of data. “Voluminous” and “data advantage” used to be considered one in the same but as sources become commoditized, volume alone is no longer enough and new quality dimensions are at play.
In an attempt to demystify the murky and overused term “data moat,” let’s zoom in on the elements of training and feature data that create a true moat. Tigers and truffles will help bring life to each below.
It’s worth noting that we’ve built a laundry list of barriers to entry from technological capabilities (e.g. data evaluation & pipelines, entity resolution, hypothesis testing capabilities, and orchestration of the system) to business assets (e.g. credit/equity network effects, colocation of consumer investing experts and technologist, brand recognition). The purpose of this piece is to dig into just the data moat.
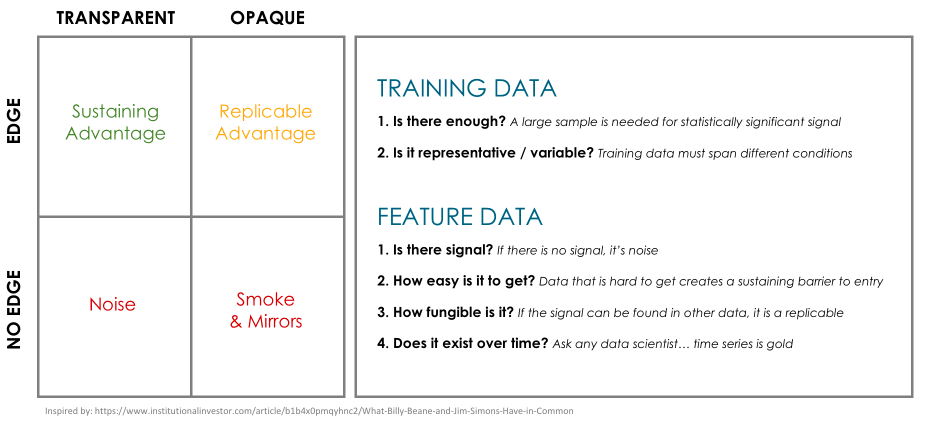
For us, the data moat translates into an investing edge. As described in institutional investor, the level of transparency around an edge says a lot about the value and longevity of that edge. Being opaque implies that the advantage can be replicated, otherwise there would be no reason to be cagey about it. Being transparent implies that there is a sustaining advantage that is often structural. At Circleup we have built barriers to entry in both training data and feature data that give us the confidence to pursue a systematic investing strategy and to be transparent about our emerging strategy here and here and here and here. I’ll stop. As listed above, there are a handful key questions to ask about training data and feature data to determine the resilience of the moat.
TIGERS & TRAINING DATA
Training data is the input that teaches a model what to predict (mentioned as most valuable data source in @1:04:02 of Invest Like the Best podcast). At CircleUp we predict the future revenue growth of early-stage private companies so our training data is ground truth financial data from such brands. This is a tremendous barrier to entry. For this training data to be effective we need to have (1) enough volume and (2) a representative/variable sample. The volume allows for better predictive performance and a representative/variable sample makes it more generalizable and robust across different scenarios.
Now bear with me for a brief tangent (shoutout to Ashlee Bennett for the inspiration). Imagine you and your friend (an algorithm) are walking through the jungle. You turn a corner and see a tiger. What do you do? You have never seen a Tiger in-person but instinct sets in so you run as fast as you can. You survive. The Algorithm has seen a handful of Tigers but has no reason to believe they are dangerous so it doesn’t move. The Tiger attacks.
You clearly outsmarted the algorithm. But why?
For the algorithm to recognize danger in this situation it would have to have been trained on thousands of instances of someone being attacked and mauled by a tiger (that is the volume point). But there are <85 tiger attacks per year. On top of that, the algorithm would have to have been exposed to maulings at different times of day, with different backdrops, and with different sized and colored cats to account for all the possible variances (this is the representative sample point).
In short, algorithms aren’t all that great at predicting very unlikely events because there typically isn’t enough representative training data to generate a reliable prediction.
Now to bring it back to private market investing – the perfect training data would be a clean and robust history of company exits. But, similar to tiger attacks, there isn’t enough training data (across size, industry, time, deal performance, etc.) to train such a model in a rigorous way. Imagine we observe two successful popcorn exits in one year and both companies have founders that were born in South Dakota. Suddenly the model only surfaces popcorn companies originating in South Dakota because 100% of the popcorn exits from the previous year matched that spec. It’s a clear spurious correlation. To solve for the problem of sample size we instead use revenue growth as our objective function – it is the metric that is most correlated with exits and has a direct relationship with enterprise value in CPG.
We have accumulated (and continue to collect) training data from tens of thousands of companies across industries and stages to test for meaningful signal. But that is not to say it is an easy task. Typical consumer funds only looks at hundreds of deals (and financials) per year. To capture this information at scale, we have built a standardized way to validate and ingest such training data so it is suited for the data science team.
TRUFFLES & FEATURE DATA
Feature data refers to the inputs that inform the output of a trained algorithm.
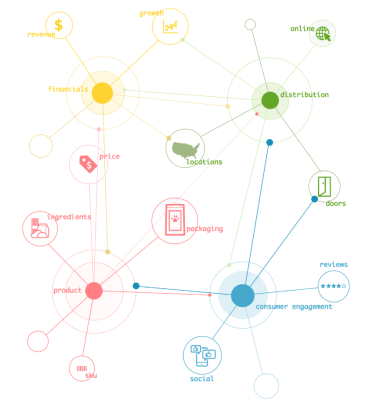
At CircleUp, feature data is everything from product reviews and ingredient decks to company location and distribution information. We use the features to discover linear and nonlinear relationships with our objective function (i.e. current and future revenue growth shown in yellow). Assuming that there is signal (although this can’t be taken for granted and warrants its own post), there are three elements of feature data that help us build the data moat: it’s (1) hard to get, (2) non-fungible, meaning it can’t be replaced, and (3) collected over time. Note this is how we think about data as a barrier to entry but there are many additional ways we measure the ultimate value (from coverage to consistency to ROI).
Now for another brief tangent, let’s talk about mushrooms. If you are starting an edible mushroom collection you’d begin by going to the store to get some button mushrooms, creminis, and portobellos. Maybe you’d even splurge on shitakes. But if you want your mushroom collection to be highly differentiated you’ll have to go beyond your local Kroger store. You’d want to go after some rare chanterelles or truffles (which are sold for thousands of $ per pound). They grow alongside tree roots and are some of the hardest mushrooms to cultivate (this is the hard to get point). Foodies will tell you they have a unique quality that other mushrooms don’t have (this is the non-fungible point). And mushrooms don’t last so they must be cultivated year after year (this is the time point).
Back to the private markets – at CircleUp we are collecting a highly dispersed set of hard to get sources to cover 1.4M consumer brands. It’s a mushroom collection we are very proud of.
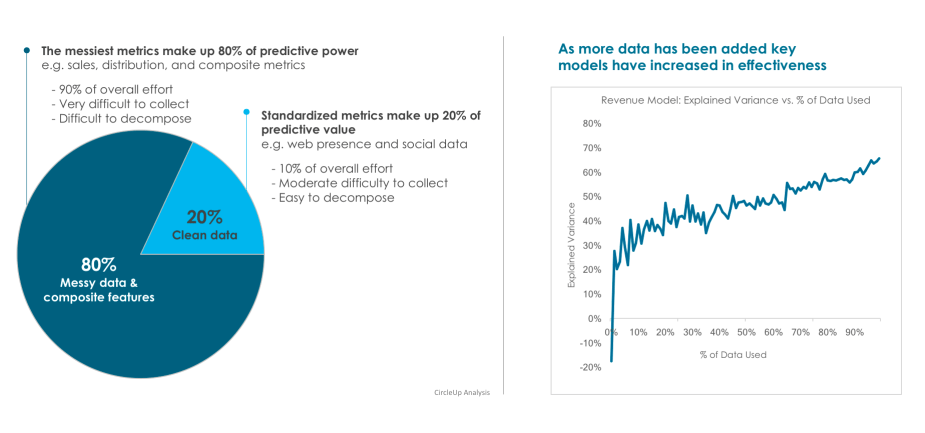
We’ve found that 80% of the predictive power in CircleUp’s models comes from variables that are the most difficult to collect (this is made up of dispersed sources that are hardest to collect, resolve and decompose). Additionally, of our hundreds of sources, no single source is particularly valuable in isolation. There are huge network effects with the data and the more data we use the accurate the output. Finally, we’ve been collecting features over time, many of which can never be back collected. This has proven to be an incredible asset, giving us the ability to build and validate predictive models out of sample and out of time.
To conclude, there are a lot of moats out there that are smoke and mirrors. Think through six key questions to determine how strong and long-lasting an edge really is:
- Is there enough training data?
- Is the training data representative?
- Does the feature data have signal?
- Is the feature data easy to get?
- Is the feature data easy to replace?
- Does it exist over time?
If you are into the theoretical side of moats, checkout Ben Thompson’s Stratechery post about moats.
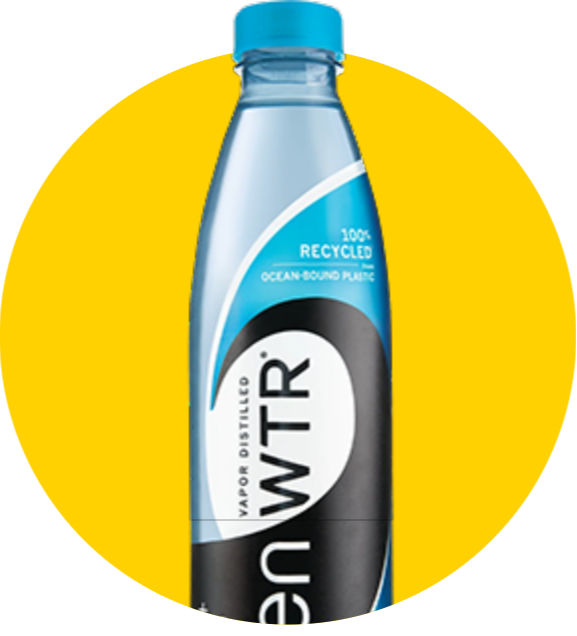
Zen Water
A water brand with an estimated revenue of $10-$20M (a +407% YoY increase)
Recess
A carbonated drink brand with an estimated revenue of $10-$20M (a +104% YoY increase)
Mad Tasty
A water brand with an estimated revenue of $1-$5M
Shine Water
A water brand that is in 3,000 retail doors (a +329% YoY increase)

All Wello
A juice brand with an estimated revenue of $1-$5M (a +89% YoY increase)
By understanding how these trends will impact the CPG landscape, you can position your business for success.
To learn more about Helio or get in touch, visit heliodata.com.