If you walk into any grocery or liquor store in the U.S., you can’t help but notice the large selection of beers available. If you look closely at the labels, you’ll notice something interesting—many of the beers now sold in the U.S. are also made in the U.S.
Americans, long the subject of European jokes about lack of beer selection and quality, have not only caught on to the craft beer craze—they’re leading it. In 2016, there were 5,301 breweries in the U.S. and 99% of them were craft breweries. This represents an increase of over 700 craft breweries since 2015 and a staggering 165% increase from the 2,000 craft breweries in operation just six year ago. Craft beer is currently a $23.5 billion market and growing at 6% annually in volume, compared to 0% volume growth for the beer industry as a whole. While this is a slow down from the 13% growth in volume the craft industry saw in 2015, it is still significant given that major brewers have been buying up microbreweries recently and counting what were formerly craft beer sales as their own. Microbrewing is clearly a movement that continues to have incredible momentum and it’s one worth understanding.
At CircleUp, we analyze the consumer goods sector to provide capital to promising brands and bring valuable, data-driven insights to the investors and entrepreneurs we work with. Using our machine learning platform Helio, we mapped 4,005 breweries operating in the U.S. Although there are more breweries in the country, we focused on those with clearly identifiable headquarter locations. We first grouped the brewery headquarters by state, with the results of that analysis below.
Number of Brewery Headquarters by State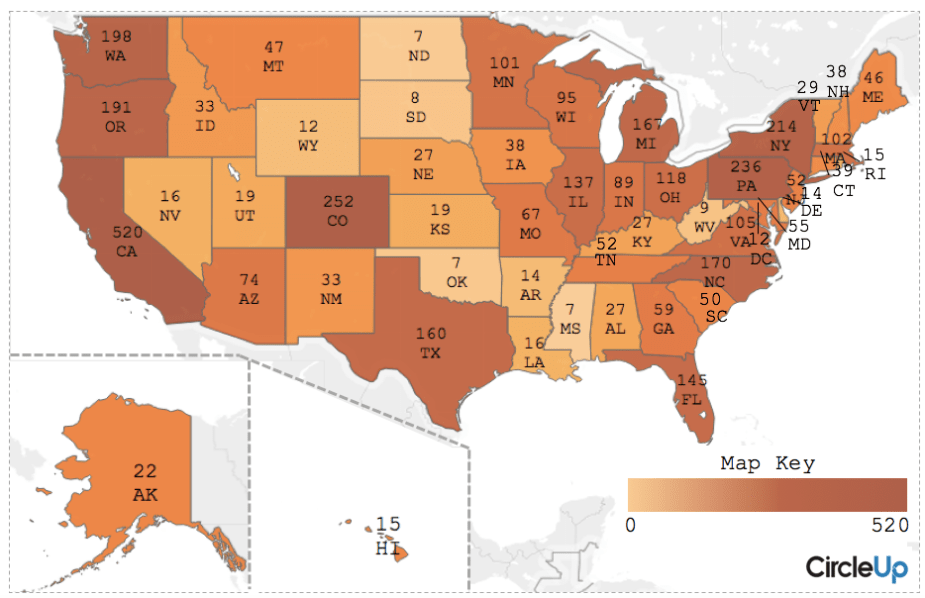
California leads the U.S. in brewery headquarters with 520. Not surprising, given the Golden State is home to nearly 40 million people. Colorado comes in second with 252 brewery headquarters, almost half the number that are in California. This is somewhat surprising, given that Colorado is home to only 5.5 million people, about 15% of California’s population. When scaling for population and taking the brewery to resident ratio into account, California drops to 23rd among states with only 1.3 brewery headquarters per 100,000 people. Colorado still ranks high, coming in third after Oregon and Vermont, as seen below.
Number of Brewery Headquarters by State per 100,000 People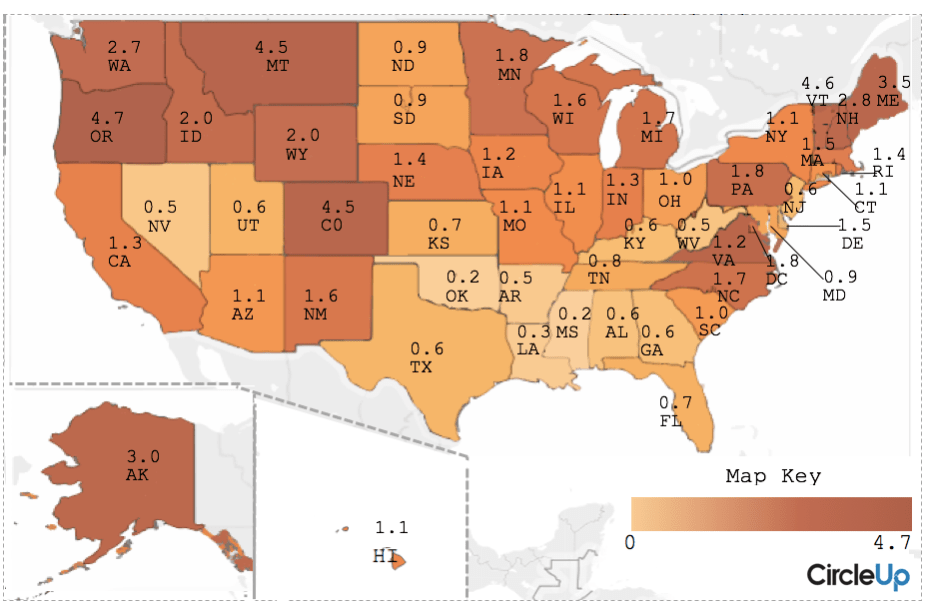
Clearly, something interesting is happening in Colorado. Zeroing in on the state sheds light on another development in the craft brewery movement: the rise of the neighborhood brewery. These breweries, prevalent in the state, serve local clientele often without even bottling or canning beer. They sell straight from the tap to people who stop by in-person. Craft brewing is now a $1.7 billion-dollar industry in Colorado alone—so it’s something investors would do well to pay attention to, especially as the sector continues to grow while the overall beer industry remains stagnant.
Next, we got a bit more granular with the data and looked at the cities home to the most breweries.
Cities Home to Most Brewery Headquarters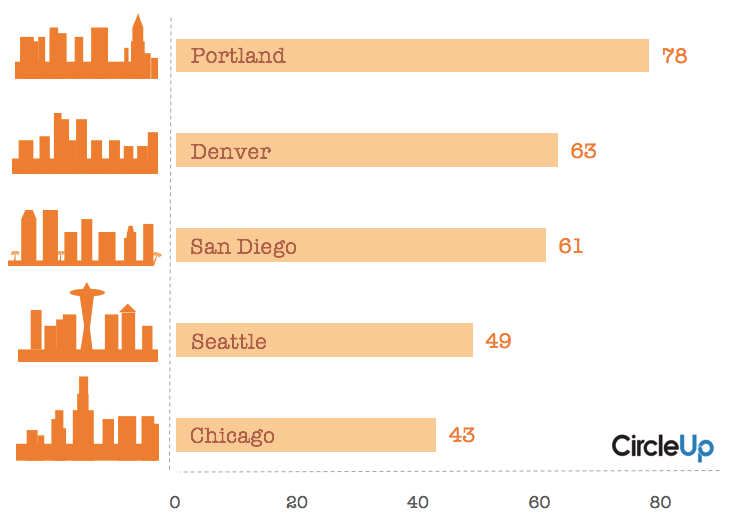
It’s probably not surprising that Portland ranks number one amongst U.S. cities. The city has a long history of craft brewing, and every year, holds the Oregon Brewers Festival, attracting 80,000 people. Denver as number 2 seems fitting in light of Colorado’s unique neighborhood brewery scene. San Diego has seen an increase in brewery openings since the Great Recession and is poised for further growth. In late 2016, the City of San Diego launched an initiative lowering the cost breweries pay to hook up to local water supplies, encouraging job growth in the sector.
Using Helio, we can quickly understand the landscape of any given industry, examining billions of data points across various metrics to determine where there is growth, and what’s driving that growth. This data can empower both early and later stage investors and lead to more methodical and targeted deployments of capital across the entire consumer goods landscape. This creates a more efficient market, which helps entrepreneurs thrive with the resources and capital they need. That’s something we can all raise a glass to.
The views and opinions expressed in this post are not necessarily those of CircleUp or its affiliates. Data from Helio is for illustrative purposes only. It is not meant as an indicator of future company performance or as a measure of suitability for investment.
Zen Water
A water brand with an estimated revenue of $10-$20M (a +407% YoY increase)
Recess
A carbonated drink brand with an estimated revenue of $10-$20M (a +104% YoY increase)
Mad Tasty
A water brand with an estimated revenue of $1-$5M
Shine Water
A water brand that is in 3,000 retail doors (a +329% YoY increase)
All Wello
A juice brand with an estimated revenue of $1-$5M (a +89% YoY increase)
By understanding how these trends will impact the CPG landscape, you can position your business for success.
To learn more about Helio or get in touch, visit heliodata.com.